
🔥Q2 Shockwave: Is ZIM Playing the Long Game or Losing Ground?
🚨 10 Hard Questions to Decode ZIM’s Q2 Story!

🎖️Subscribe /✨Sponsorship /📊Exclusive Report /🙏Rate us /🎁Send Gift

🔥 Greetings, Maritime Mavericks!
ZIM’s Q2 2025 results are out — and they’re messy, volatile, and fascinating.
Revenue dropped. Margins collapsed. Profit almost vanished.,
But beneath the pain, a high-stakes transformation is unfolding:
A modern LNG fleet, higher guidance, and a play for survival in volatile markets.
The real question: Is ZIM quietly setting up for a comeback — or bracing for a deeper storm?
1️⃣ Did ZIM actually grow in Q2 2025?
2️⃣ What happened to profitability?
3️⃣ How bad are freight rate pressures?
4️⃣ Is ZIM’s fleet strategy working?
5️⃣ How strong is ZIM’s cash position?
6️⃣ Did ZIM raise its full-year guidance?
7️⃣ What about volume performance?
8️⃣ How exposed is ZIM to U.S. tariffs?
9️⃣ Where’s the bright spot?
🔟 Is this ZIM’s turning point — or breaking point?
Let’s break it down in 10 critical questions that reveal the true state of Zim in Q2 2025👇
1️⃣ Did ZIM actually grow in Q2 2025?
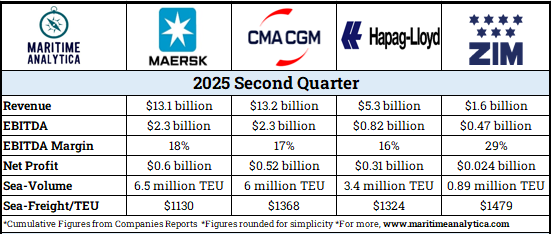
Revenue: $1.64B (–15% YoY)
Adjusted EBITDA: $472M (–38%)
Adjusted EBIT: $149M (–69%)
💡Despite $472M EBITDA, negative $426M free cash flow signals rising liquidity risks.
2️⃣ What happened to profitability?
Net Income collapsed to $24M (–94%)
EBITDA margin down to 29% (from 40%)
Rising LNG fleet costs & lower freight rates crushed margins
💡Net income plunged 94% YoY as weaker spot rates and higher charter costs crushed margins.
3️⃣ How bad are freight rate pressures?
Average freight rate: $1,479/TEU (–12% YoY)
Pacific demand weak, Transpacific lanes underperforming
Spot rates remain unstable despite Gemini reroutings
💡Revenue fell 15% on just a 6% TEU drop, proving ZIM sacrificed yield to defend share.